


Concepts You Have to Know for Data Science Interviews — Part I: Distribution
Most frequently asked questions in data scientist interviews


Office Hours
Most frequently asked questions in data scientist interviews
It’s the beginning of the year and a lot of people are looking into new opportunities and new challenges. I remember from my multiple rounds of recruiting in the past that I regularly struggled to find a good comprehensive resource to prepare for my data science interviews, so I decided to put one together myself.
If you are starting a new round of recruiting or looking to up-skill your data science knowledge for the new year, hopefully you will find this cheatsheet/crash course helpful as a starting point. This is the first article of the data science interview series where I want to mention some basic distributions and basic concepts related to distributions that get asked frequently in data science interviews.
The concepts I will touch on in this series is by no means exhaustive, it’s an aggregated list for the most asked questions in data science interviews, or concepts good data scientists should be familiar with, based on my experience.
Basic Statistics Concepts Related to Distributions
This might seem too basic for some of you, but it’s important to make sure you truly understand the definitions, differences and use cases for simple statistic concepts like mean, median and mode. Several key concepts I see coming up time and time again in interviews:
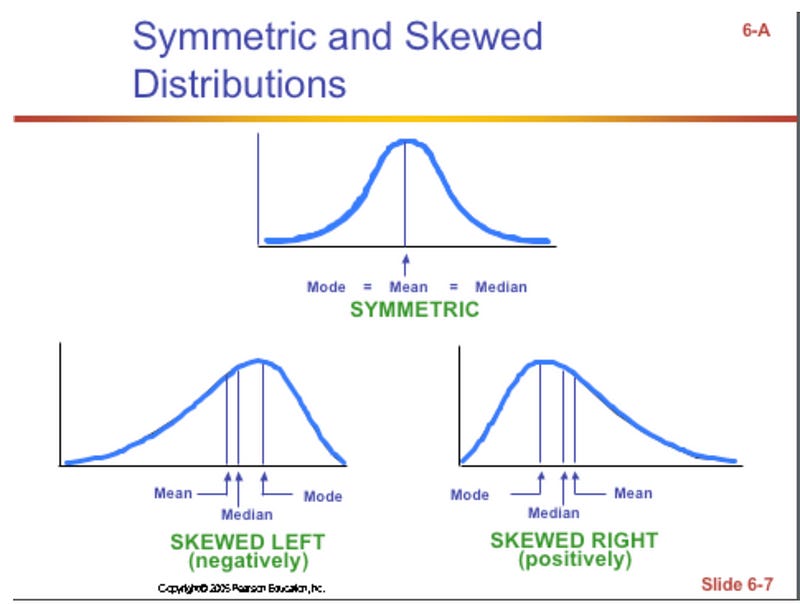
Mean is different from the median in the sense that the mean is more easily influenced by outliers and the skewness of the distribution. The mean will be the same as the median for symmetric distributions. The mean will be smaller than the median for left skewed distributions and will be bigger than the median for right skewed distributions.
Mode represents the “peak” of the distribution and it overlaps with both the mean and the median for symmetric distributions. For left-skewed distributions, the mode is bigger than both the median and the mean; and the mode is smaller than both for right-skewed distributions.
Distributions
Distributions are a very important concept in statistics that gets tested in interviews a lot. There are a lot of distributions out there, but several important and common ones get mentioned and used over and over again in interviews:
The Normal Distribution
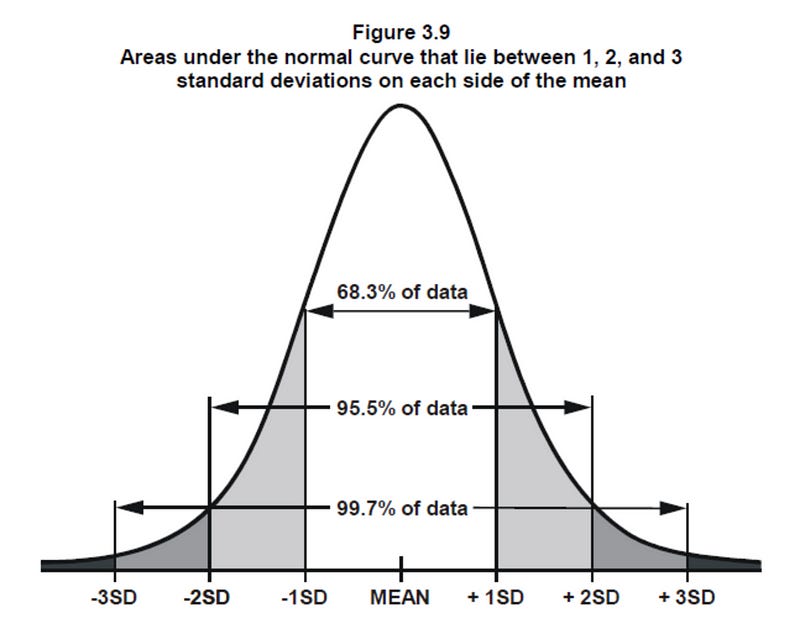
This is THE most important distribution to know as many things in life follow the Normal Distribution — height of adults, IQ of adults etc. It’s important to know that the mean, median and mode are the same for the Normal Distribution as it is symmetric and NOT skewed.
The Normal Distribution has symmetric variation around the mean that is defined as standard deviation. This means it’s equally likely for values to be higher or lower than the mean. But it’s less likely for values to vary from the mean by a larger magnitude than a smaller magnitude (regardless of the direction). In fact, for the Normal Distribution, 68.3% of values lie within 1 standard deviation away from the mean; 95.5% lie within 2 standard deviations away from the mean and 99.7% values are within 3 standard deviations from the mean.
The Normal Distribution is determined by only two parameters — the mean and the standard deviation. The mean determines the center of the distribution — where the peak (mean, median and mode) lies whereas the standard deviation determines the shape/spread of the distribution — the smaller the standard deviation, the tighter the distribution.
2. Bernoulli Distribution
The Bernoulli Distribution describes a single experiment that has ONLY two outcomes. We usually describe these two outcomes as success-1 and failure-0 for simplicity. The most common examples of this distribution are things like a flip of a coin, where a head would be a “success” and a tail would be a “failure”; or the weather outcome in terms of whether it will rain, where rain would be a “success” and no rain will be a “failure” (or the other way around if you really hate rain).
There is only one parameter for this distribution — the probability of success p. In the case of a fair coin, p=50%.
3. Binomial distribution
The Binomial Distribution is closely related to the Bernoulli distribution as it models the number of successes in repeated Bernoulli experiments.
The Binomial Distribution takes two parameters — the probability of success p and the number of repetition n. When p is greater than 0.5, the distribution is left-skewed; when it’s smaller than 0.5, the distribution is right-skewed and when p = 0.5, you guessed it, the distribution is symmetric.
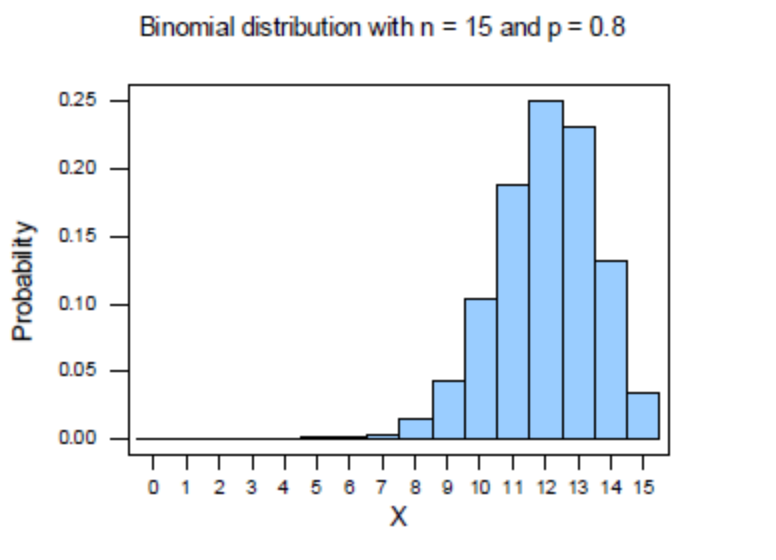
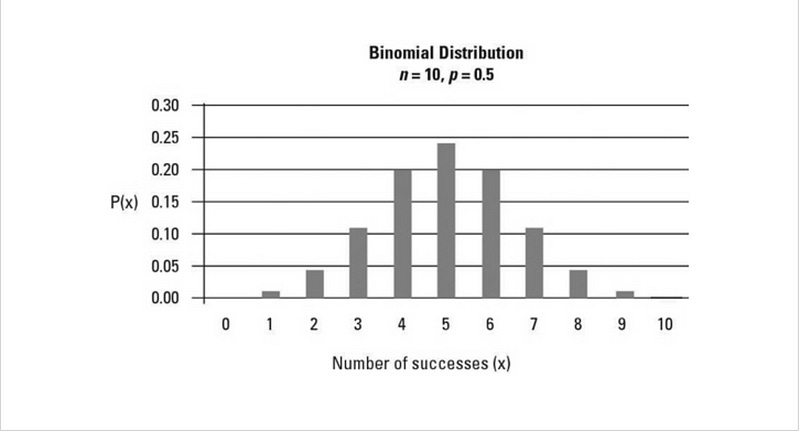
If you think the symmetric Binomial Distribution above looks a lot of a Normal Distribution, you are right. In fact, the Binomial Distribution can be approximated by the Normal Distribution when the number of experiments is big enough (with n being the number of experiment repetition and p being probability of success, the rule of thumb is when both np and n(1-p) are bigger than 10, the Binomial Distribution can be approximated by the Normal Distribution).
Other less common distributions that you might get asked about are the Poisson Distribution (it describes the number of events in a certain timeframe; the most common example is the number of customers arriving to a restaurant within a fixed time frame), Exponential Distribution (it is related to the Poisson Distribution since it describes the time interval between the events; in the customer example, it describes the time passed between each customer’s arrival within a fixed time window) and Gamma Distribution (it is similar to the Exponential Distribution in the sense that it describes the the total time until reaching a fix number of events; to continue the example, it describe the time you need to wait until having a certain number of customers arrived at the restaurant).
How these are tested
These concepts are usually NOT tested separately in the format of a school test, because interviewers want to see you can actually use those concepts to solve real world problems instead of memorizing the wikipedia pages about them. So the common questions asked are along the lines of:
“What kind of distribution does XX (e.g. the length of Facebook Marketplace page visits etc.) have?”
Follow up question: “What’s the relationship of mean and median of this distribution?” or “Do you think the mean will be bigger or smaller than median for this distribution?”
Hope this summary is helpful to your recruiting process. Keep in mind that you won’t be a stats expert by just reading several articles about it; it takes practice to master stats knowledge. So the best way to familiarize yourself with this is to utilize this knowledge whenever you can; for example, when you research about the company you are interested in, ask yourself what the most important metrics for this company would be and what you think their distribution looks like.
Don’t know what to read next? Here are some suggestions:
Why I Joined McKinsey as a Data Scientist
Should you ever be a data science consultant despite the 80-hour work weeks?towardsdatascience.com
Productivity Tips for Data Scientists
How to work better, smarter but not necessarily harder as a data scientisttowardsdatascience.com
Top Qualities Hiring Managers Look For In Data Scientist Candidates
Some of these are arguably more important than writing efficient codetowardsdatascience.com